Welcome
Welcome to the Connecting the Culm Mapping website.
We have created an interactive map that contains data and information with the aim of improving resilience of the Culm catchment to the impacts of climate change. Information was co-created and based on catchment walkovers, partner engagement, and an updated whole catchment model. The mapping includes Potential Areas for Improved Resilience (PAIRs) that were co-developed with a range of partners and sense-checked during catchment walkovers. The website includes results from the whole catchment model, including a scenario of the PAIRs across the Culm.
If you wish to make suggestions you can also obtain a login that allows you to edit the map interactively based on local knowledge.
For more information on the project please see also the Blackdown Hills AONB website.
Contextual and Walkover Data
This information is based on catchment walkover surveys by geomorphological and natural flood management experts. From the geomorphological experts, it identifies modifications to the river, geomorphological features and system pressures. These can help us understand where natural processes could be curtailed or enhanced in their capacity to improve flood or drought resilience. From the natural flood management experts, it identifies potential for nature-based solutions (as part of the PAIRs). The catalogue is maintained by JBA Consulting.
Potential Areas for Improved Resilience (PAIRs)
When the Connecting the Culm project started in 2019, the PAIRs were initially based on the national maps of potential areas for Working with Natural Processes (WwNP) developed by the Environment Agency. The WwNP data is based on Defra, Environment Agency and Natural Resources Wales research published here. The WwNP maps helped identify possible areas where different types of river and catchment management approaches may have the potential to help reduce flood risk by working with nature. These maps were then refined based on partner engagement, use of the updated whole catchment model to understand potential adaptation pathways and expert knowledge.
In 2021, PAIRs within thirteen sub-catchments were updated following improvements made to the whole catchment flood model first established as part of the original project and targeted stakeholder engagement workshops.
In 2022, catchment walkovers were undertaken for six sub-catchments. This allowed for a more in-depth investigation into the PAIRs in these areas. The observations from the site visit are reflected in the refined PAIRs datasets within the interactive map.
Risk Data and the Culm Whole Catchment Model
The maps enable you to overlay a range of risk data including the Environment Agency Flood Maps and the historical flood map. Some outputs from the updated whole catchment flood model and how predicted flooding compares with the largest event on record (November 2012) can be overlaid. The “Model Results” menu allows you to compare the flooding with and without the prioritised PAIRs.
The areas shown on the map are based on national data sets and models, so they should not be relied on for detailed planning, but they give an indication of the types of land management measures that could be considered.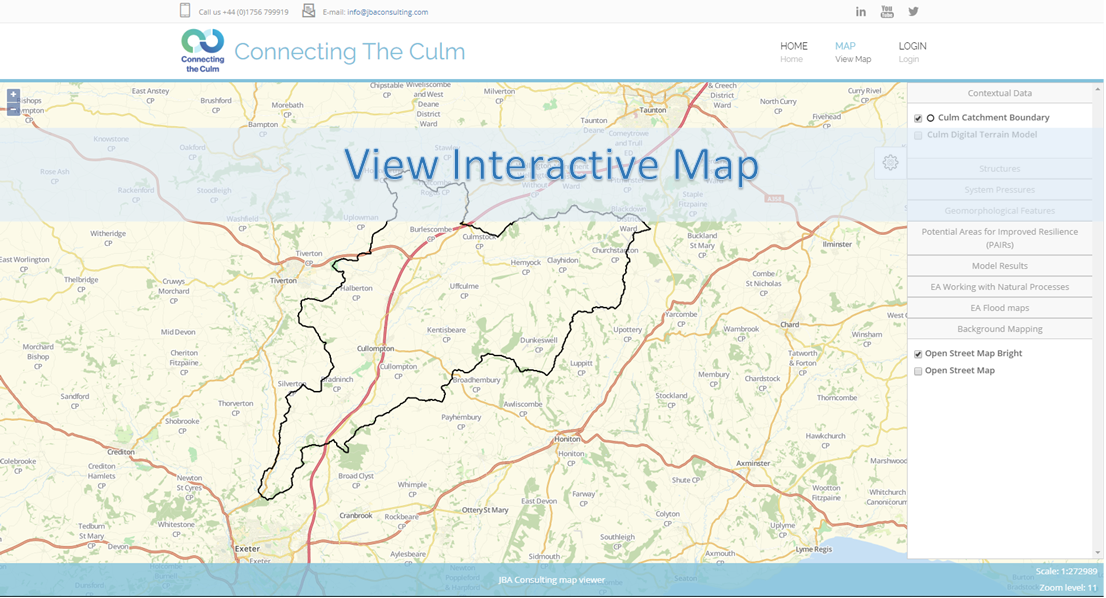
About the maps
The maps are provided as a research resource and we cannot make definitive statements about the accuracy of the information they contain. In particular, we know that some of the information could go out of date, or that there may be relevant data points we are not aware of.
Privacy Policy
Read our Privacy Policy If you have a login for the site, our Privacy Policy sets out how we handle your personal data. You do not need a login to view the data. Logins are created by website administrators.